
Travel agencySEO · 28d · 2025
4.3× organic clicks in 28 days
Clicks 4,530 → 19,400 and impressions 58.7K → 200K, last 28 days against the previous 28, straight from Search Console.
4.3×
clicks · 28d
3.4×
impressions
28
days


Twenty documented results, each one a screenshot from the client's own Search Console, Google Ads, Meta Ads Manager or Instagram Insights. Names blurred under NDA, every number verifiable on a short reference call.
Clicks 4,530 → 19,400 and impressions 58.7K → 200K, last 28 days against the previous 28, straight from Search Console.

Shopify migration + 18 buying-guide articles. 30+ luxury brands.
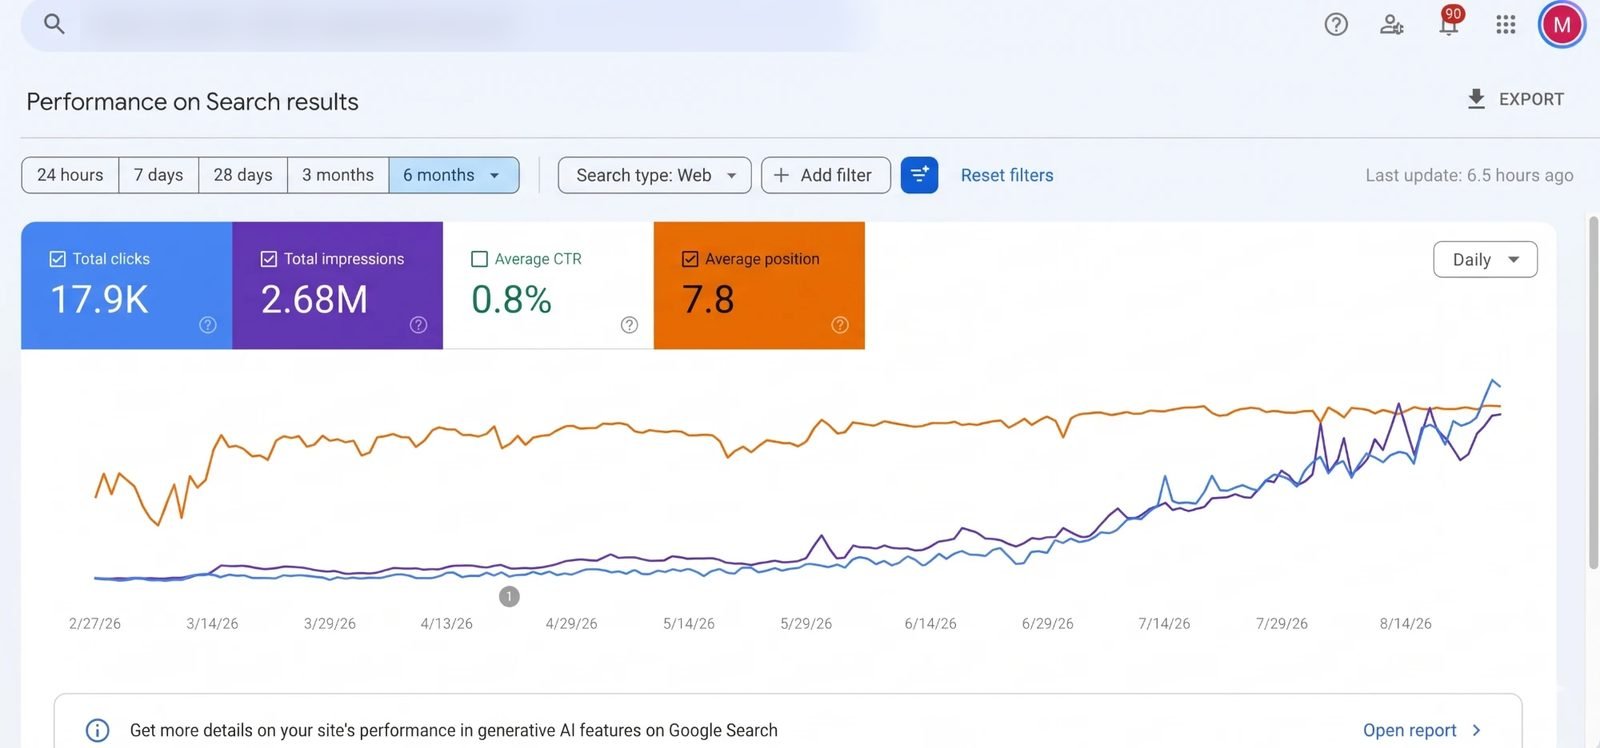
The daily clicks line climbs through the whole window and finishes well above where it started in March, with average position holding inside the top ten at 7.8. Read straight from the client's Search Console.
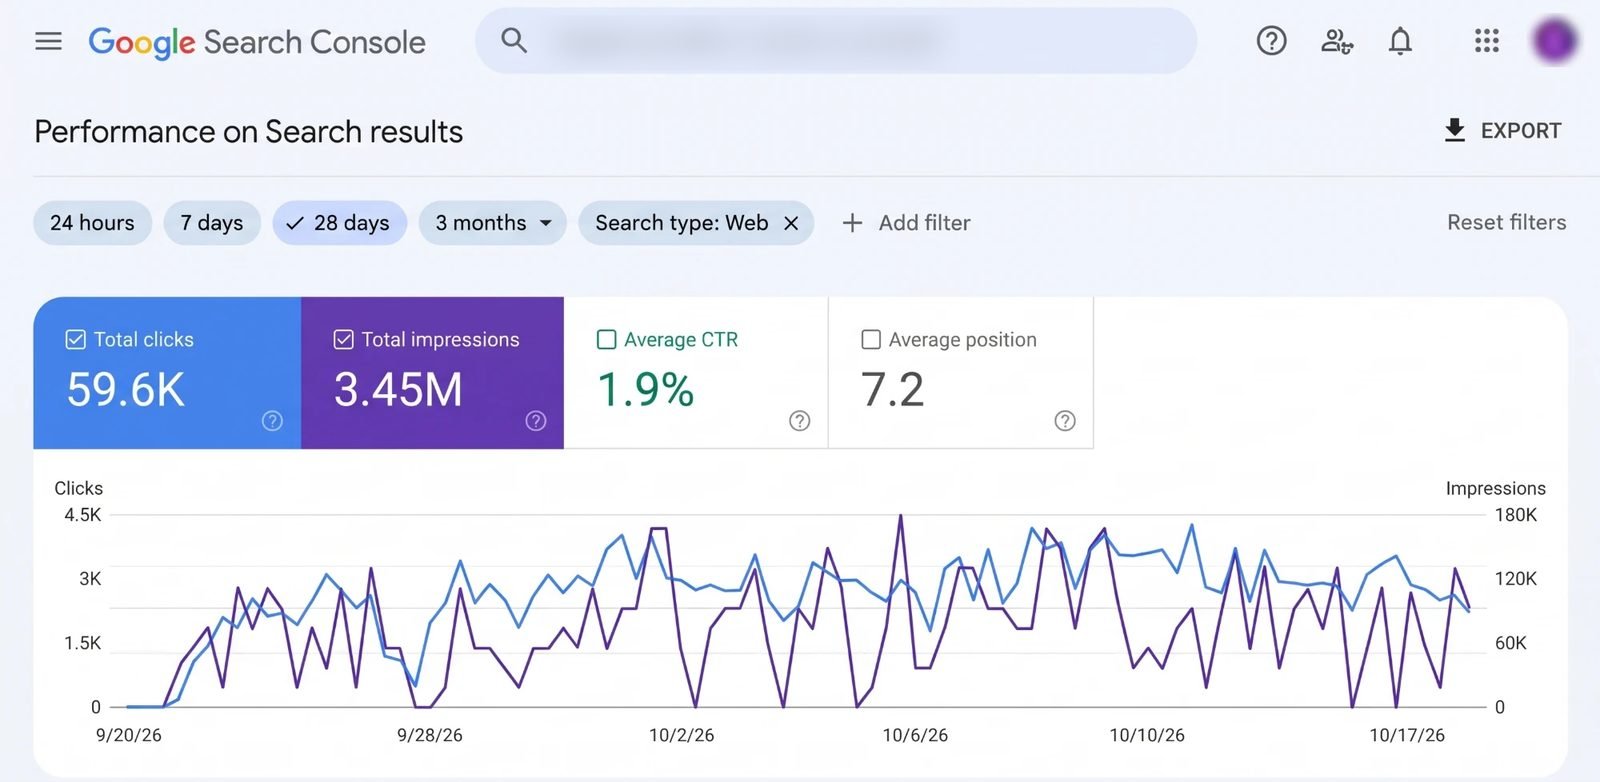
A finance site at an average position of 7.2 and a 1.9% click-through rate across 3.45 million impressions. The 28-day window is the one Search Console shows by default, so there is no hand-picked date range here.

May 2025. ₹32.8K spend → ₹1.59L purchase value. Catalog campaigns, static + UGC creatives, India-wide D2C.

31 May to 29 Jun 2025. ₹3.85L spend → ₹18.6L purchase value. UGC-led creatives, hot/warm/cold audiences.

April 2025, 30-day window. Catalog ads + UGC. Best ad set 15.53× at ₹701 per purchase.
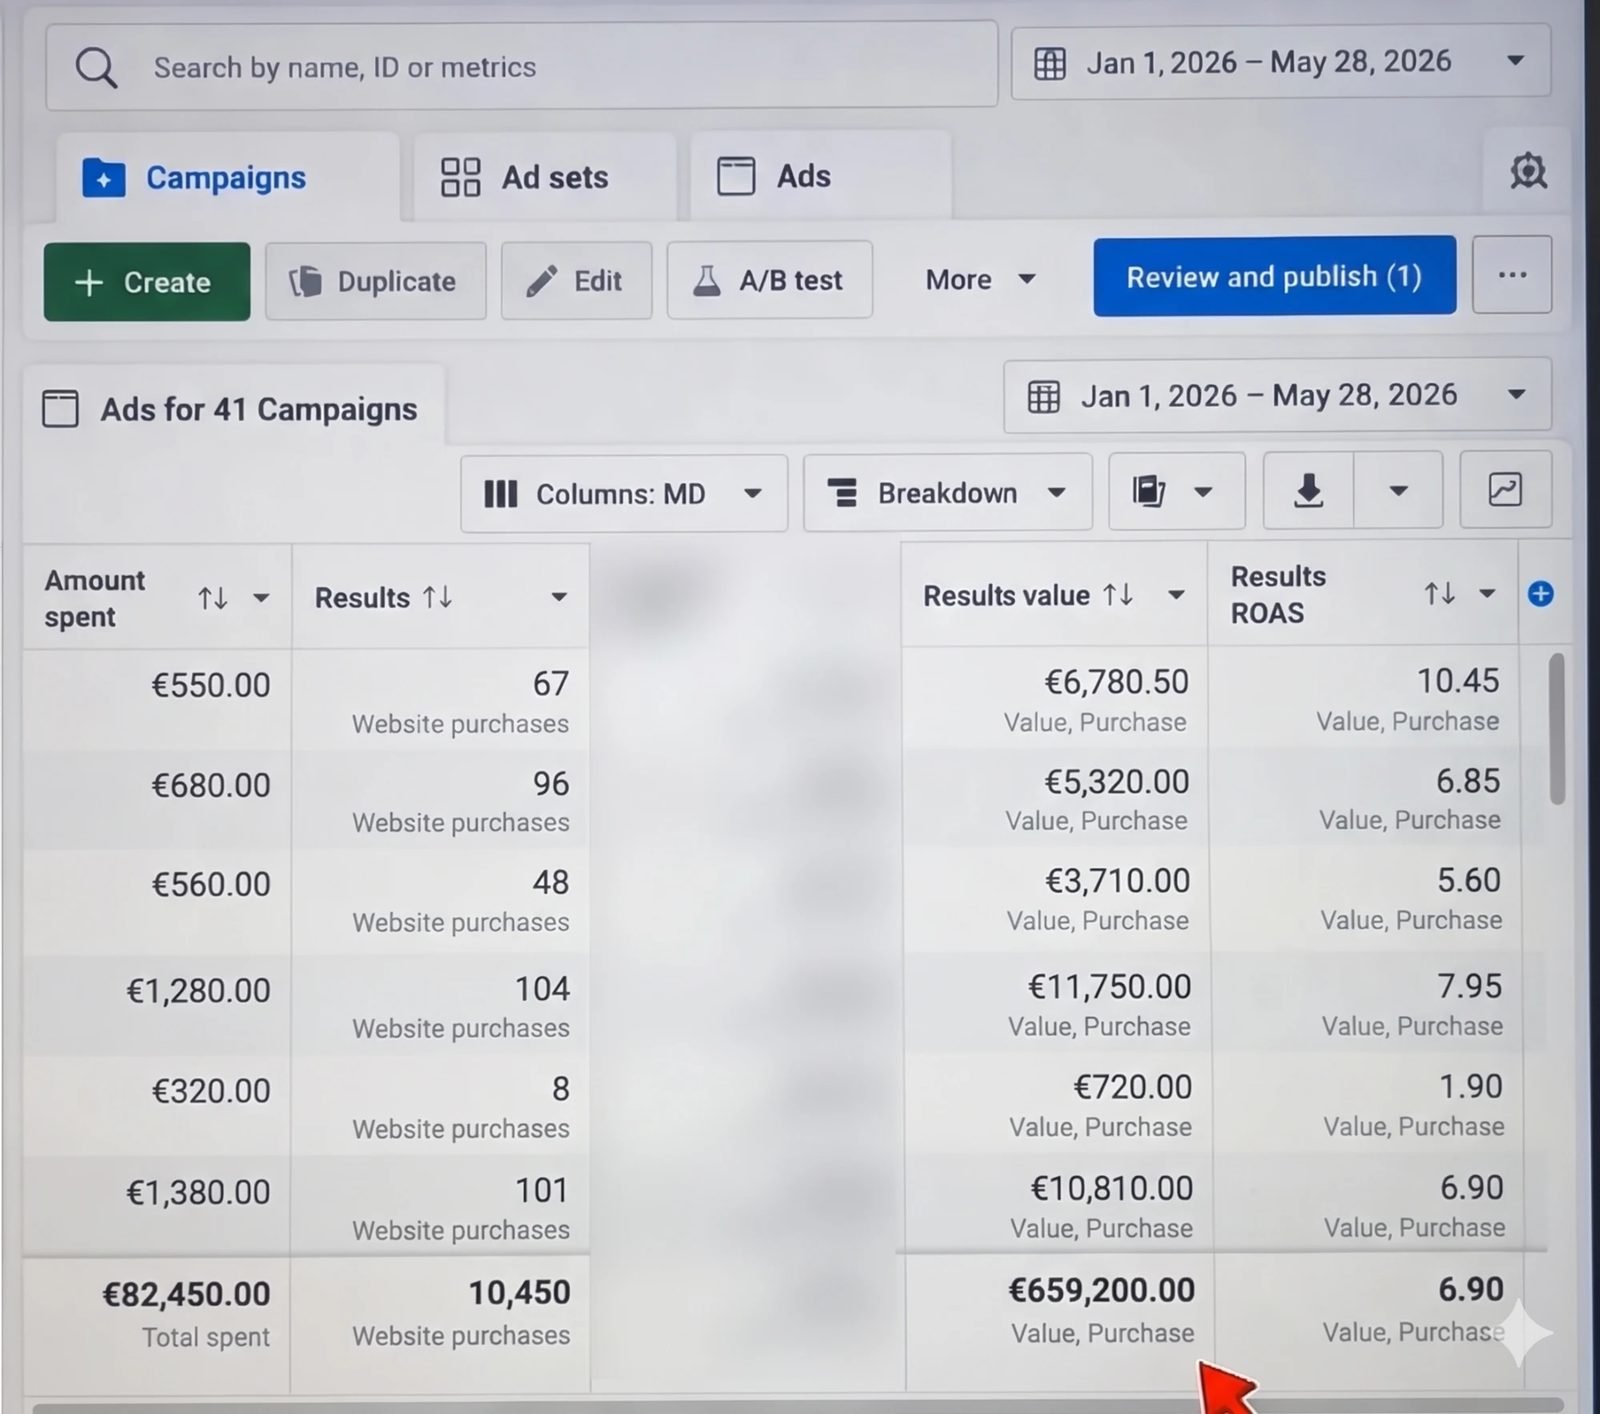
10,450 website purchases at €7.89 each over five months. The best campaign in view returned 10.45×, the weakest 1.90×, and the account still closed at 6.90× overall. Figures from the client's Ads Manager, campaign names blurred.
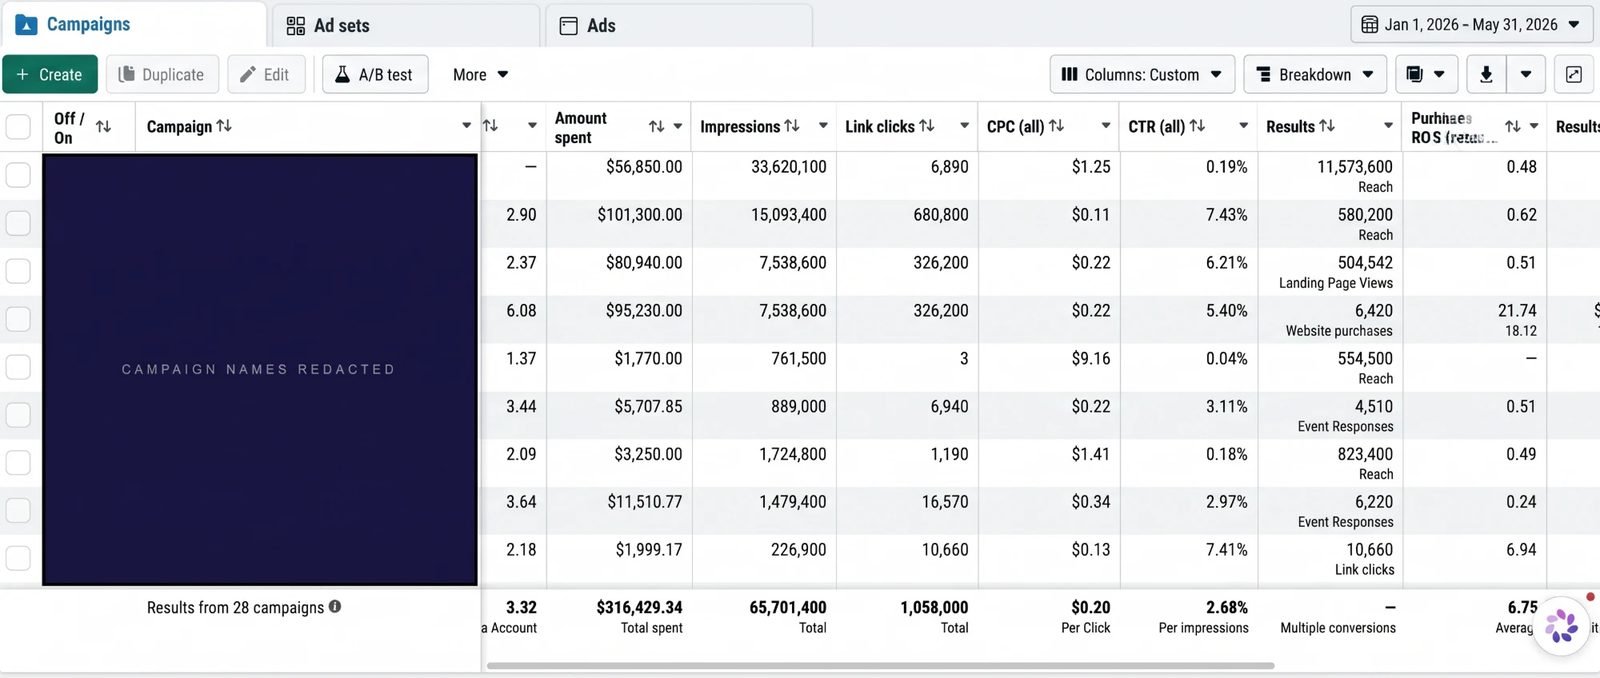
A mixed account with reach, event-response and purchase campaigns side by side. The purchase campaign in view turned $95,230 into 6,420 website purchases at 21.74× ROAS. 2.68% click-through across 65.7 million impressions. Campaign names redacted.
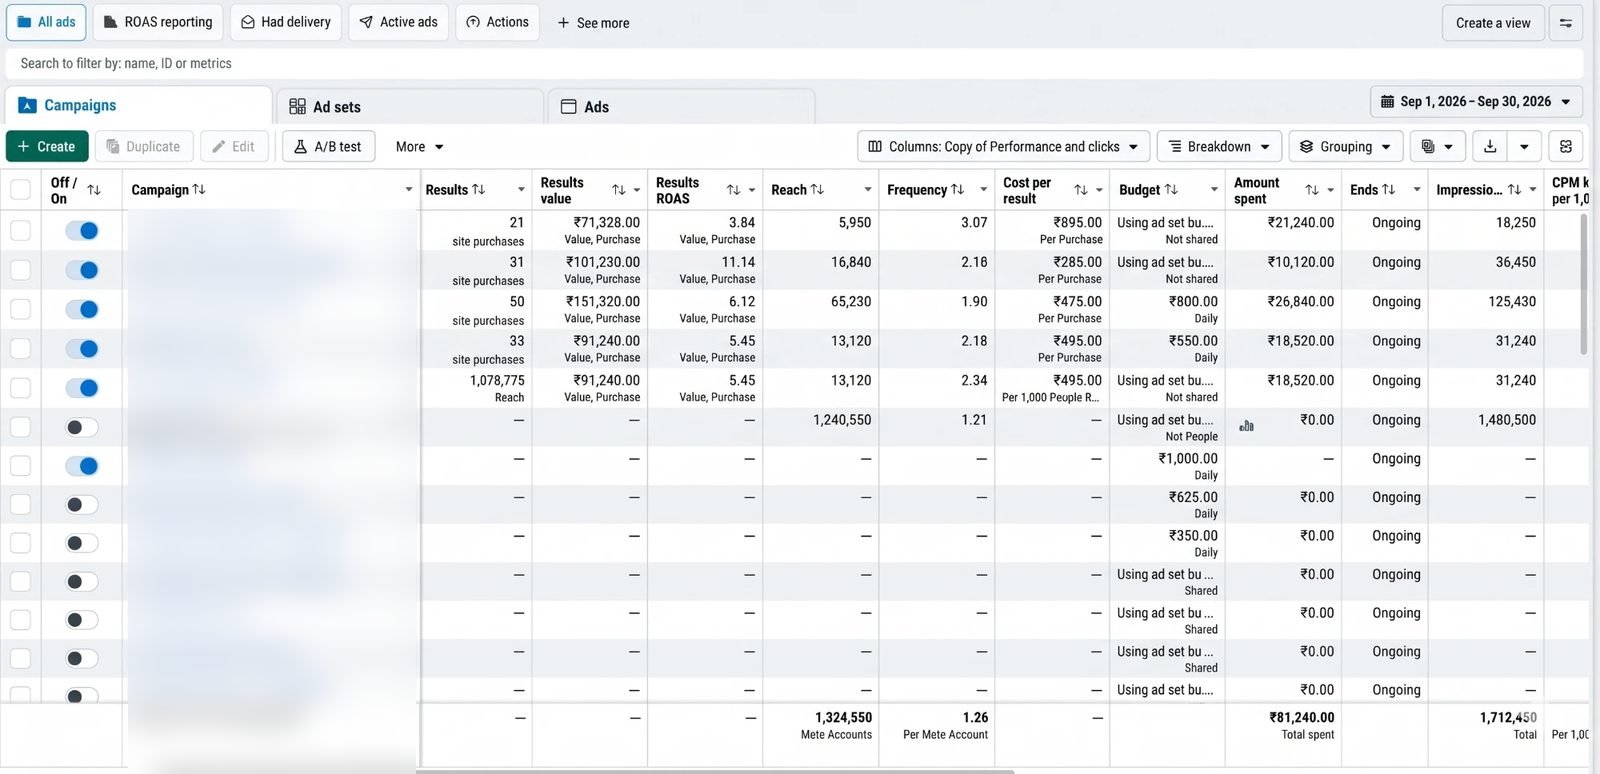
Same account, eight months on: 135 purchases and ₹4.15L of purchase value on ₹76.7K of spend across the campaigns with purchases, up from 53 purchases and 2.4× in January. Spend rose 69% and the return on every rupee more than doubled.
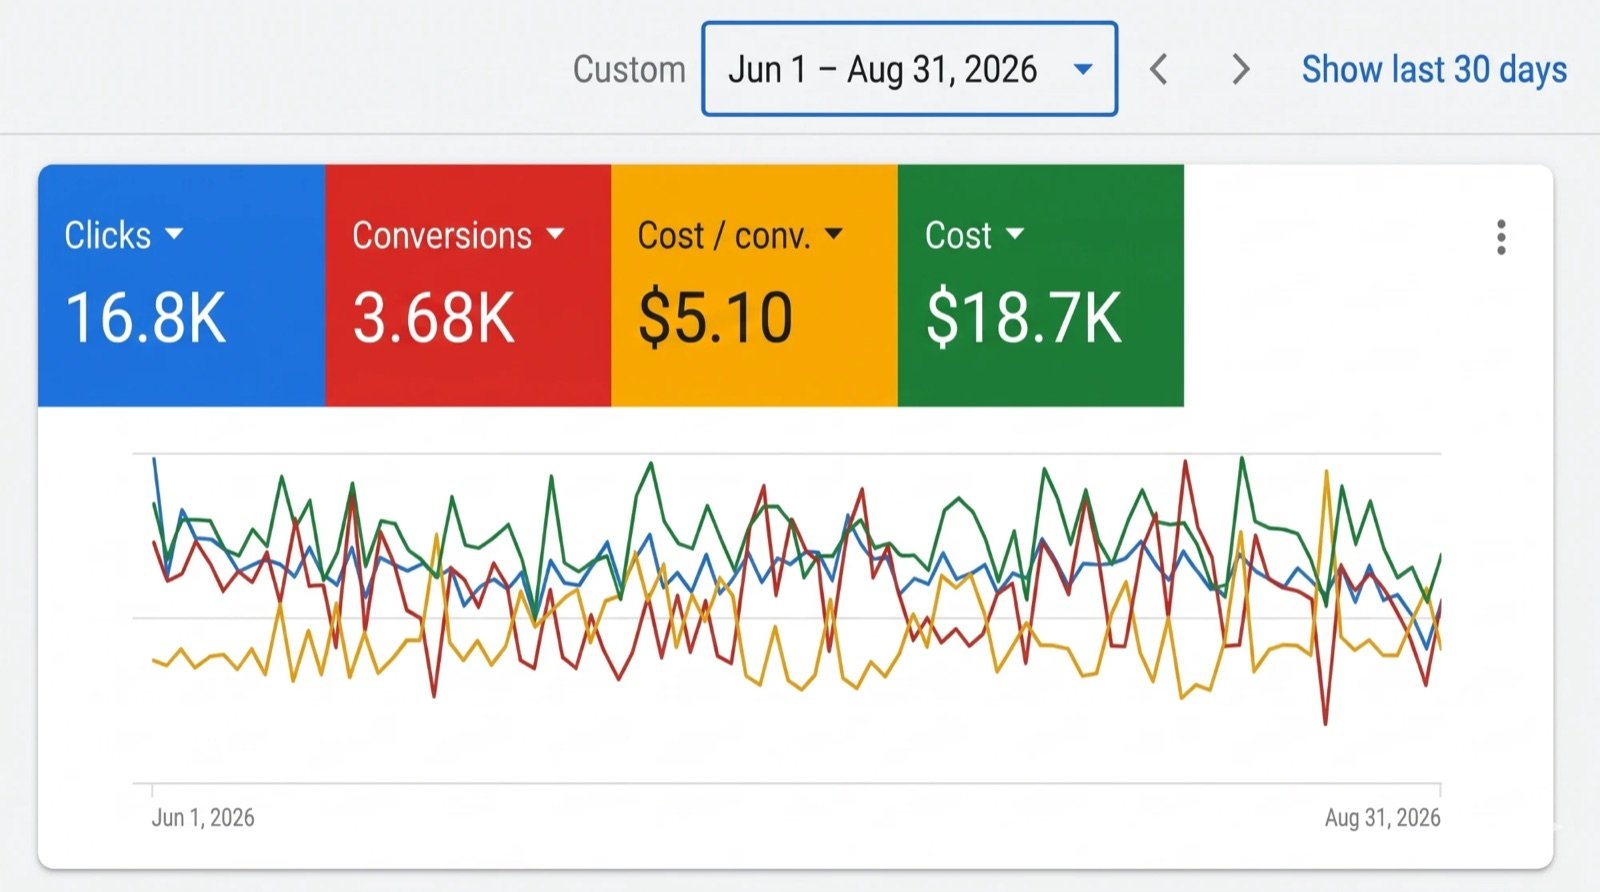
A service business with one job for Google Ads: repair enquiries. Average cost per click $1.11 and one conversion for every 4.6 clicks across the quarter, tracked in the client's own Google Ads account, not a dashboard of ours.
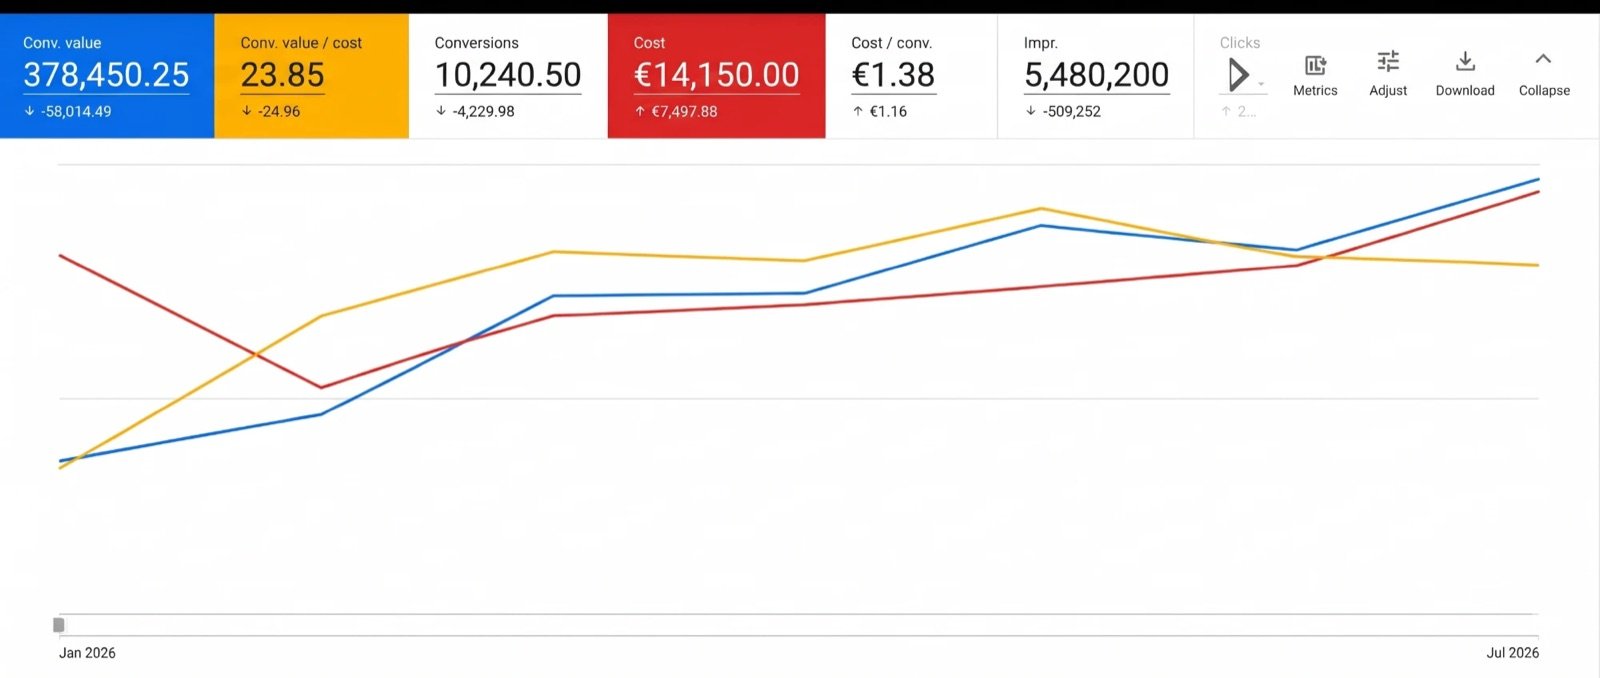
Performance Max, Shopping and Search for a very large parts, lubricants and accessories catalogue sold into Greece and Cyprus. The brief: consolidate a fragmented account and scale spend without losing return. Result: 10,240 conversions at €1.38 each from 5.48 million impressions, and €23.85 of conversion value for every euro, as tracked in the client's own account.
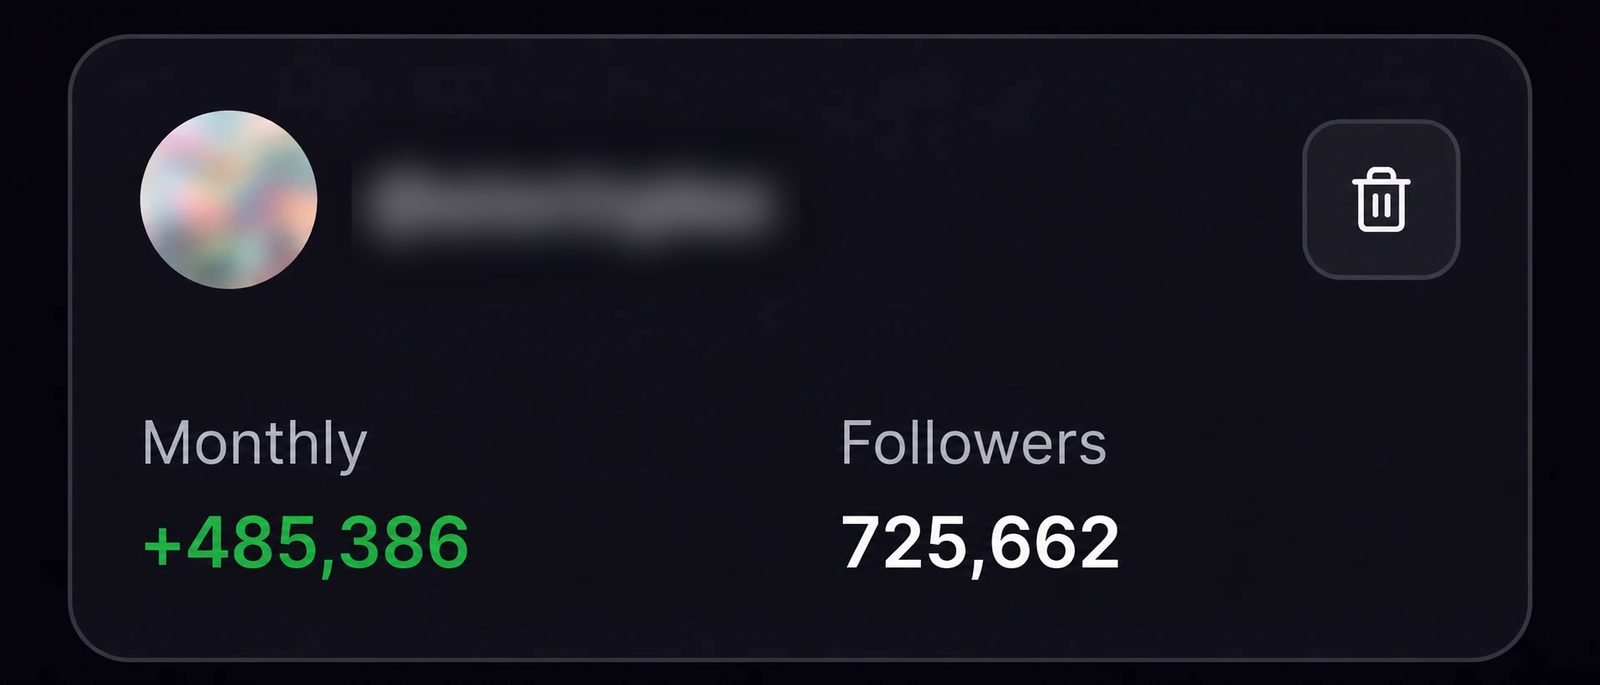
Instagram Insights for the same 30 days: 163,976,281 views, 76% of them from non-followers, 14.7 million interactions and 42.6 million unique viewers. Posts carried 139.7M of the views and Reels 24.2M. The tracker card above is an independent app reading the same account.
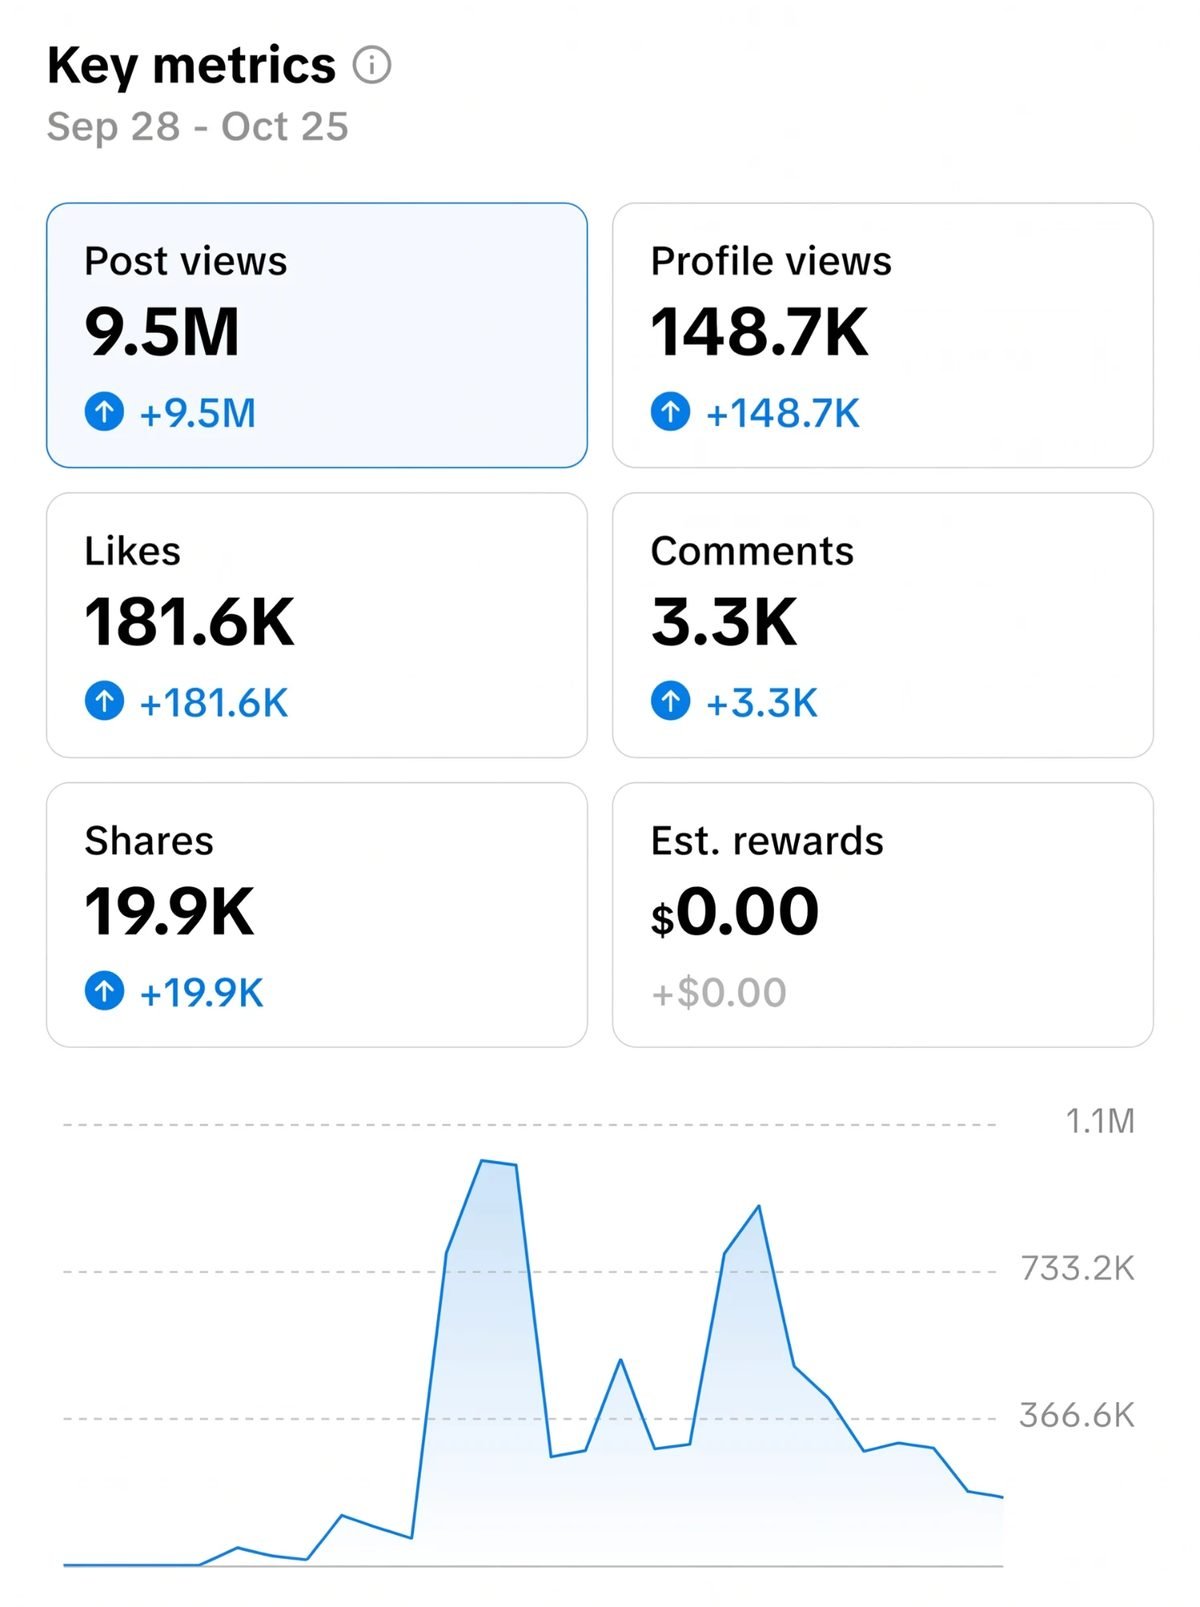
148.7K profile views and 3.3K comments on top. Two days went past 700K views, from posts, not promotion: the estimated-rewards line reads $0.00 because nothing was paid for. Account name withheld.
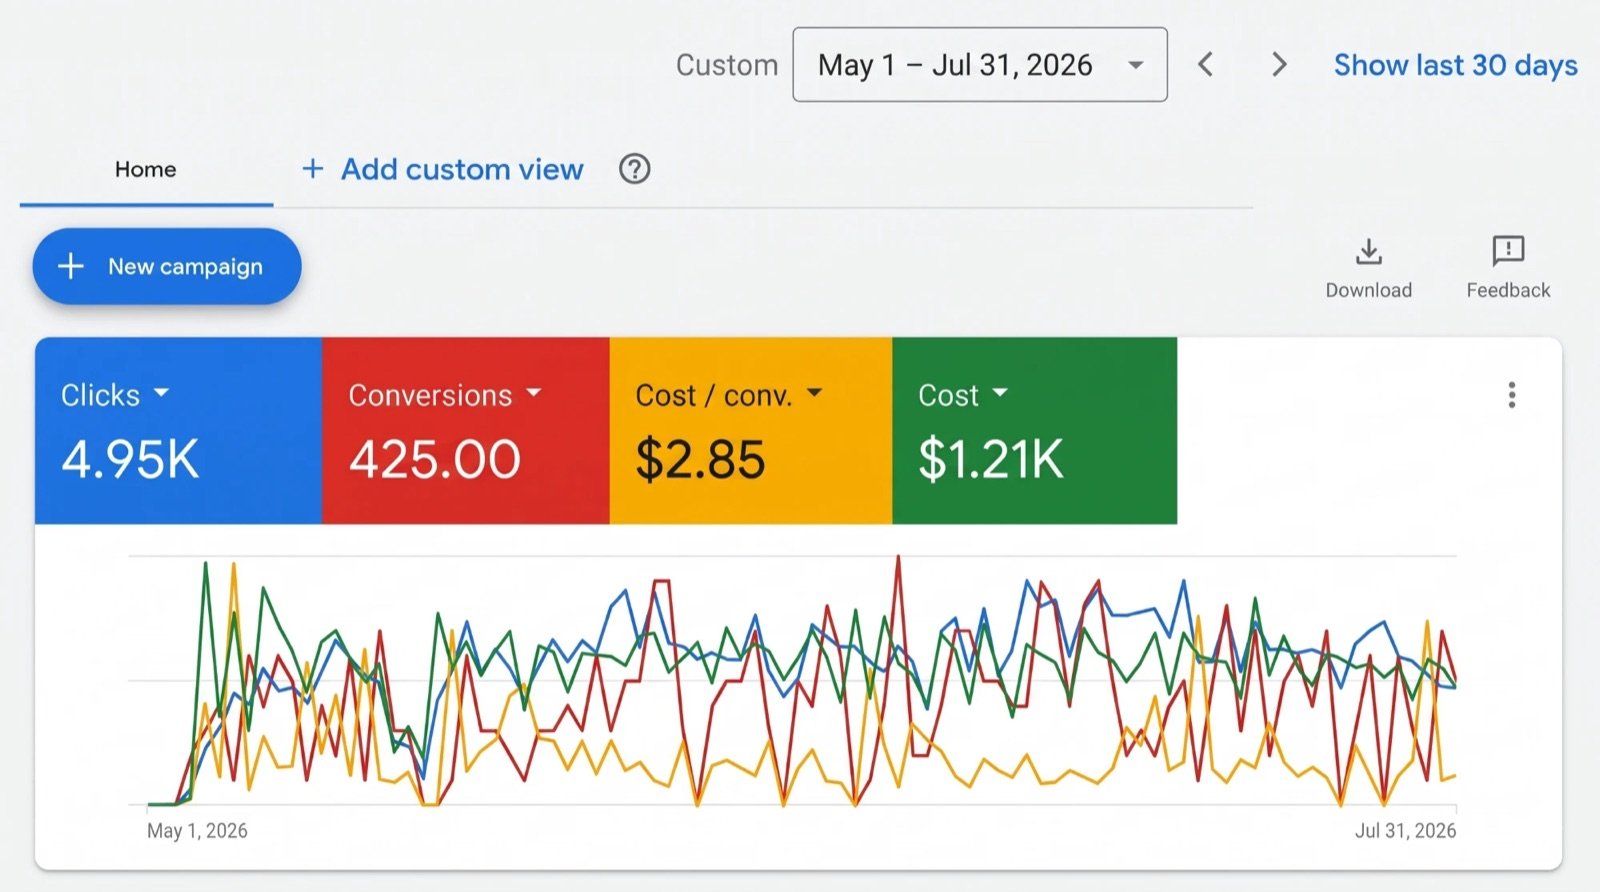
A small studio budget, and the method still holds: $0.24 average cost per click and one conversion for every 11.6 clicks over three months, with the spend held under $15 a day.

Shopify migration. 75-year heritage brand. Brand filters, gifting flows, search.
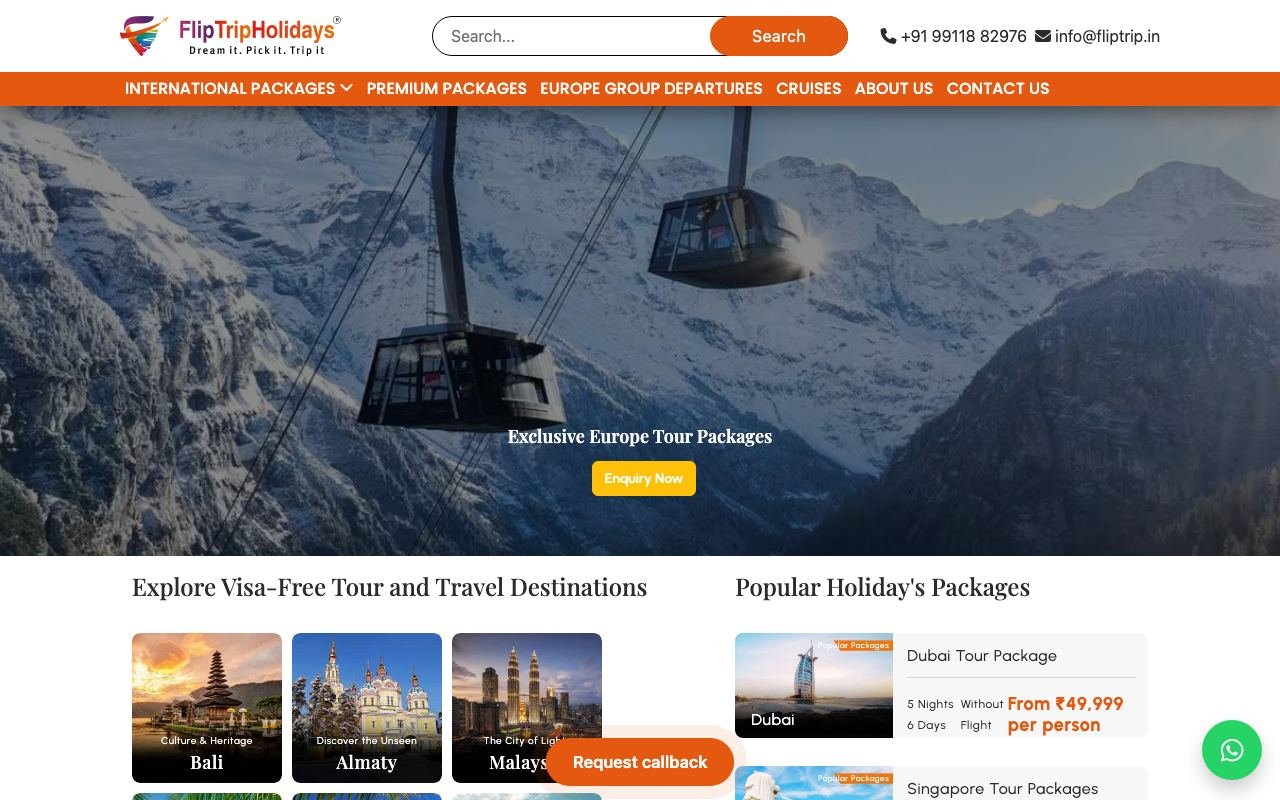
Custom CMS with enquiry routing + WhatsApp integration. Premium package pages.
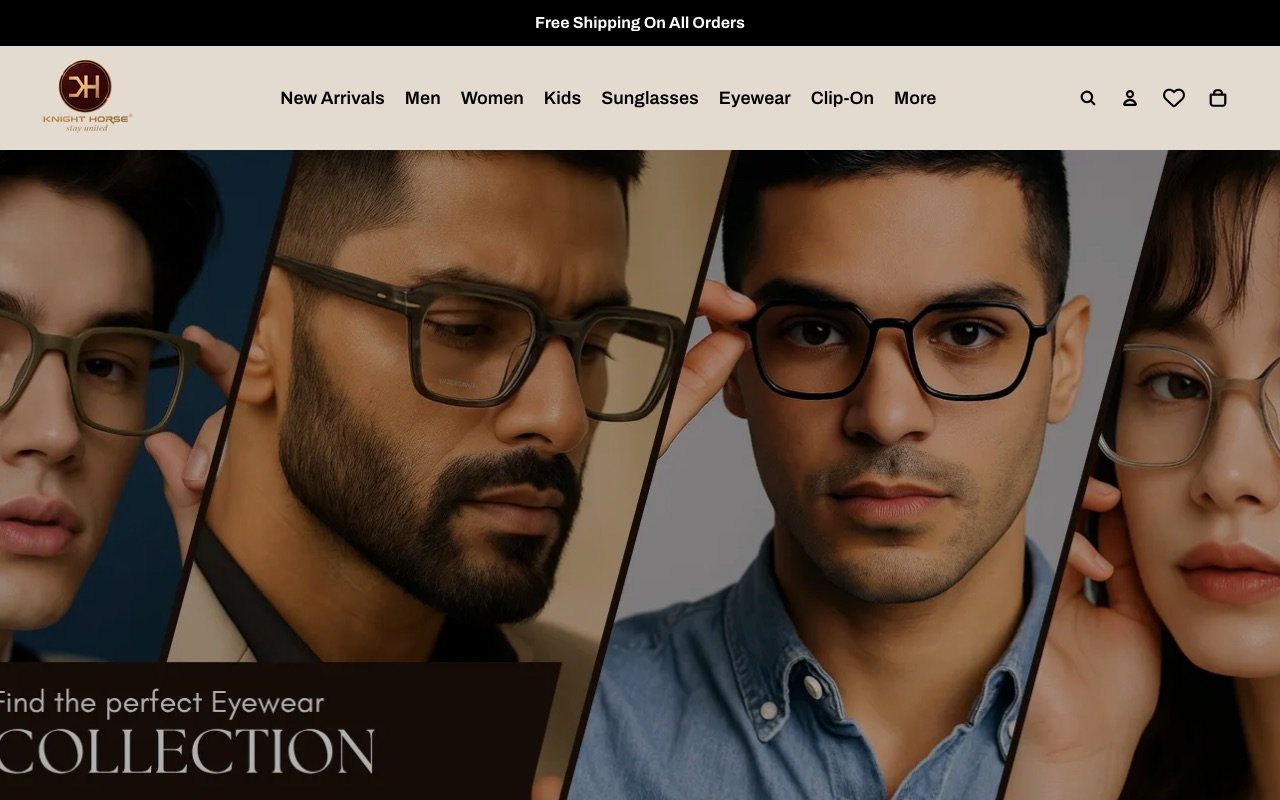
Shopify build. Men/Women/Kids/Sunglasses/Wedding collections. 7-day exchange + COD.
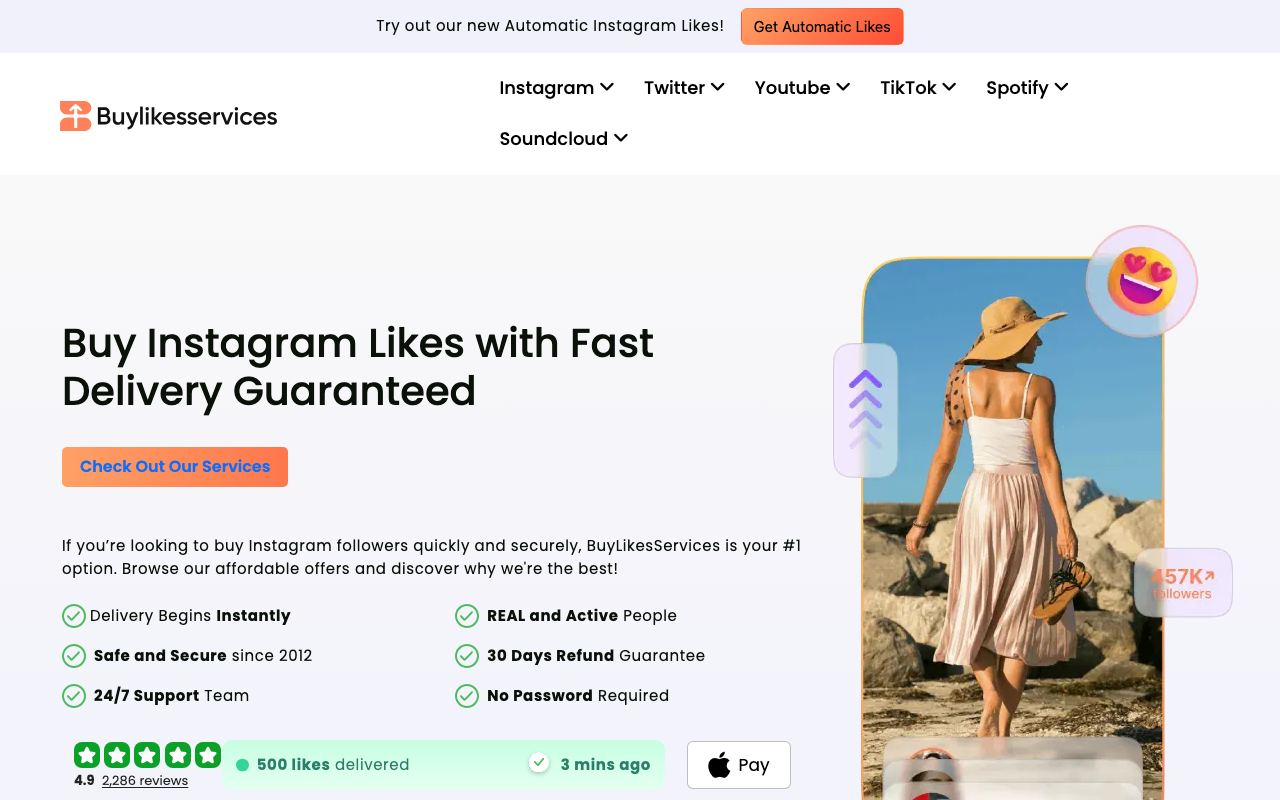
Multi-platform service marketplace (IG, TikTok, YouTube, X, Spotify, SoundCloud). 50+ programmatic landing pages.
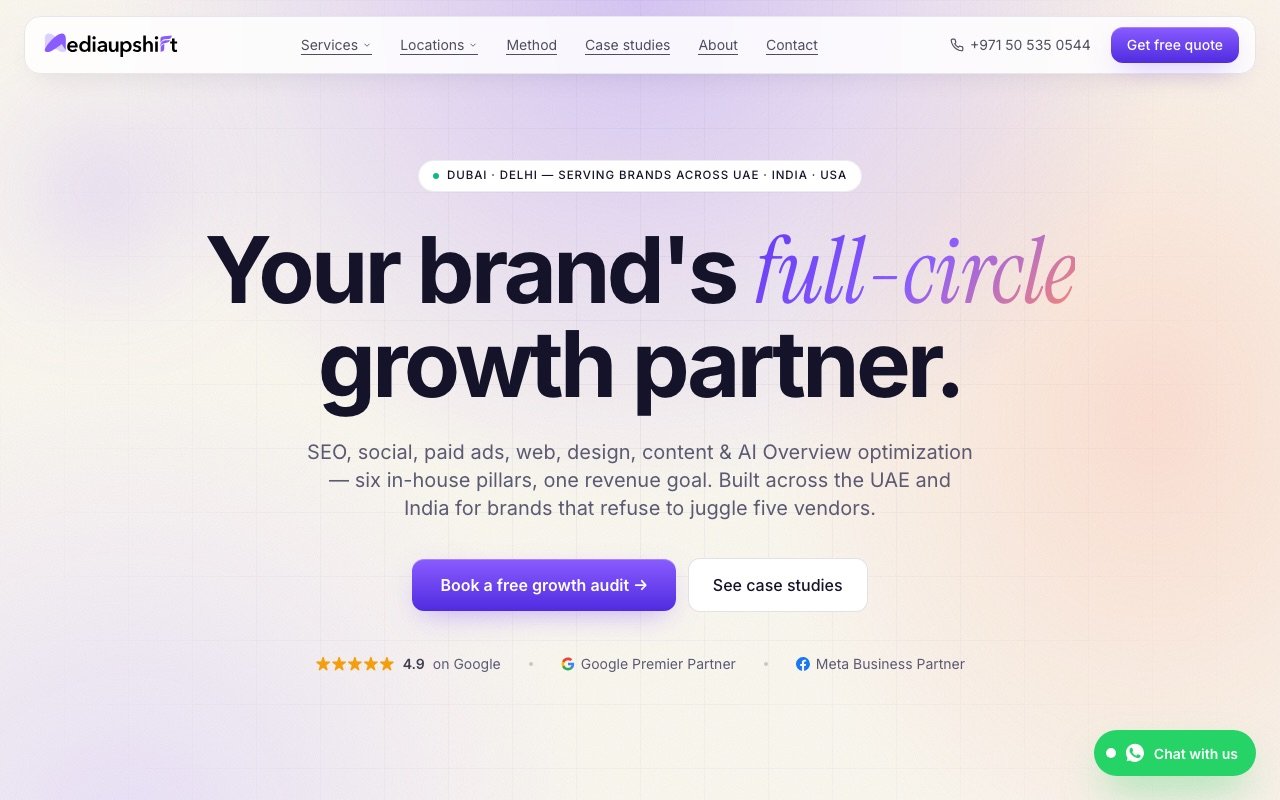
Built in-house with the same patterns we ship for clients. Editorial type system, dashboard visualizations, multi-region CTAs.
Plus 180+ more clients across hospitality, real estate, healthcare, F&B, B2B SaaS, and professional services. See more on a discovery call →
Once NDA is signed, we walk through full GSC screenshots, named clients, ROAS dashboards, and arrange reference calls with current customers.
How we measure
A case study is only a case study if the numbers came from a third-party source you can verify. We do not use our own dashboards as proof.
Pulled directly from the client's own Google Search Console. Screenshots shown. Brand names blurred per NDA. Numbers verifiable in 60 seconds on a reference call.
Pulled directly from Meta Ads Manager or Google Ads. Real spend, real ROAS, real campaign names blurred. Attribution model disclosed.
PageSpeed, Core Web Vitals, conversion-rate uplift measured via GA4 + Hotjar. Before/after data verifiable on call.
Travel, hospitality, F&B, eyewear, healthcare, real estate, fintech, B2B SaaS, marketplace, watches, jewellery, lifestyle apparel, legal, and more.
Dubai, Abu Dhabi, Sharjah, Riyadh, Mumbai, Delhi NCR, plus diaspora UK and US brands. Each case study tagged by region.
Most clients ask us to blur their name. The numbers, screenshots, and methodologies remain real. We will introduce you to anonymised clients directly when you are evaluating us.
Author and reviewer

Built Mediaupshift from a 1-person SEO desk in Delhi (2017) into a Dubai-Delhi growth agency. 13+ years across SEO, performance, and brand. Reviews and signs off every retainer.
Connect on LinkedIn
Operations Manager at Mediaupshift. Runs day-to-day SEO retainer execution and client coordination for Mediaupshift retainers.
Connect on LinkedIn